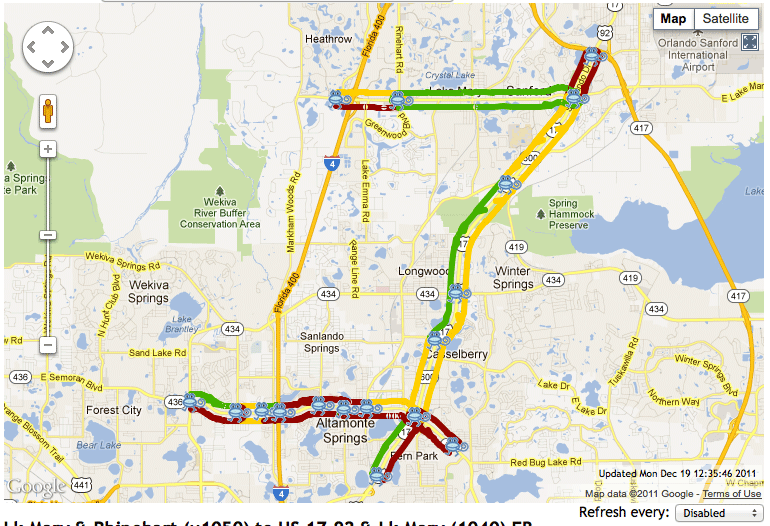
Using Google Maps, we are able to display our data in a quick and easy fashion that can be used by DOTs to quickly see road performance. Auto-refresh and full screen mode are both supported, allowing the customer to put the map on a large screen and quickly reference it at any time
BlueTOAD (Bluetooth Travel-time Origination And Destination) is a combined hardware and software system that detects BlueTooth signals from phones, headsets, music-players, etc... and uses those detections to determine traffic flow and speed.
I developed most of the backend for this system including data processing and front end presentation of the data. The system is based on a heavily modified Drupal installation, allowing us to utilize (and contribute back to) open source while keeping a large codebase of our own modules. The modules I wrote handle all the client-side presentation and data processing. We designed a re-entrant, non-resident data processing system, allowing us to handle large quantities of data (over 1,000,000 detections per day) while keeping resource utilization low. My work was integral in UI design and data presentation, allowing users of our system (primary DOTs) to do work that would previously take hundreds of man-hours in a few clicks.
Technologies used include Drupal for a front end framework, CCK and Views Drupal modules for presentation, Google Maps API for data visualization, MySQL for database processing, PHP for primary code development, Beanstalkd for implementing background data processing, Open Flash Chart for graphs, reports and visualizations and Log4php for logging and error management.
Project Features
-
Speed Map

-
Origin / Destination Studies
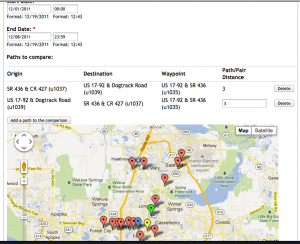
Allows a DOT to compare performance and car-counts over various sections of roadway in a few clicks. The traditional method of carrying out one of these studies is to send out post cards and hope for responses to gather data about 1 day of travel performance. Our system allows the customer to deploy devices and get thousands times more information with very little data processing time.
-
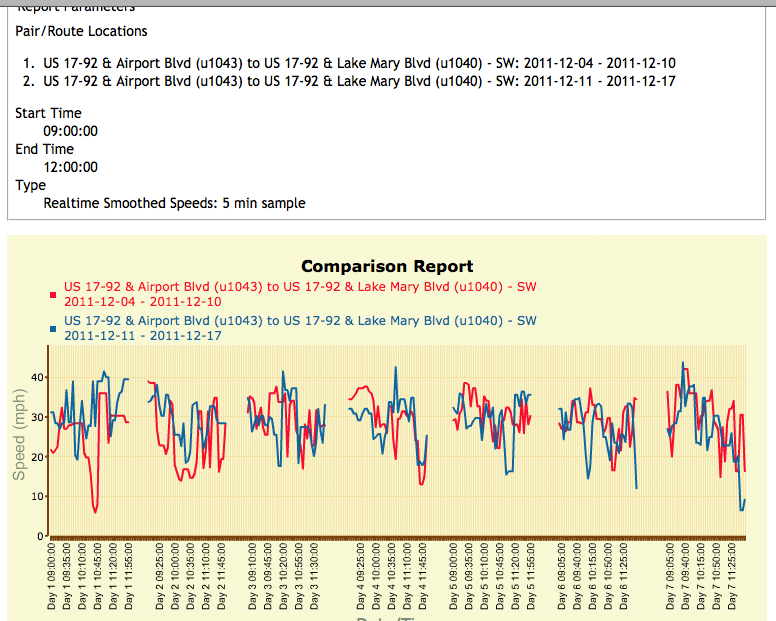
Comparison Reports
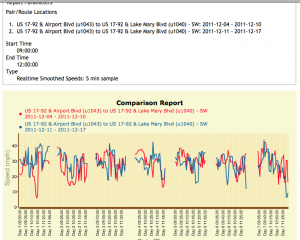
Visualization of traffic speed over multiple periods of time in the same graph and/or report to see quick comparisons between two different roads or the same road at different periods of time.
-
XML Feeds
XML integration layer providing speed and travel time information that is consumed by multiple customers to drive road signs, signal timers and other products.